
How Krippendorffâs Alpha Improves Data Reliability
Learn how to leverage Krippendorffâs Alpha to evaluate the quality of your annotated sets and inter-rater reliability (IRR).
In many AI tasks thereâs no clear ârightâ answer. This is especially true for domains like social science, sentiment analysis, and content moderation which remain in high demand. When ground truth is ambiguous, inter-rater reliability (IRR) becomes essential to AI data quality. These metrics help us understand how much of the variation in results is due to evaluator differences versus differences in the data itself.
The key question IRR answers is simple: How much do annotators agree with each other overall?
By measuring how consistently multiple evaluators apply the same criteria, IRR provides an important quality signal. Itâs often referred to as inter-annotator agreement, inter-coder reliability, or inter-rater concordance. Without strong agreement, itâs hard to trust downstream insights or the models built on top of that data.
Why IRR Matters in AI Projects
Consider a task where reviewers rate an LLMâs output as ânot toxic,â âsomewhat toxic,â or âhighly toxic.â If one annotator labels a response as ânot toxicâ and another as âhighly toxic,â something is wrong. These inconsistencies could reflect unclear guidelines, poor training, or subjective interpretations â any of which undermine trust in your evaluations.
Reliable labeling is critical to building robust, trustworthy AI systems.
Methods for Measuring Inter-Rater Reliability (IRR)
Several statistical measures exist to evaluate IRR, including:
- Cohenâs kappa
- Fleissâs kappa
- Krippendorffâs alpha (our focus here)
Krippendorffâs alpha is widely regarded as one of the most robust and flexible IRR measures, refining earlier metrics to assess categorical, ordinal, hierarchical, and continuous data. This versatility gives Krippendorffâs alpha a distinct edge over other IRR measures that may be constrained to certain data types or require complete data sets.
How to Use Krippendorffâs Alpha
A deep knowledge of the algorithm is not necessary to effectively use Krippendorffâs alpha. However, understanding the mathematics at play can provide valuable insights into its application.
Quick Start Guide for Practitioners
Leverage Krippendorffâs alpha with minimal mathematical knowledge by following these five steps:
- Identify your data type: Nominal, ordinal, interval, or multi-label
- Calculate alpha
- Interpret results:
- Îą âĨ 0.80 â Reliable
- 0.67â0.80 â Tentative
- < 0.67 â Unreliable
- Take action: Use results to refine guidelines, retrain annotators, or improve system design
- Pair with other metrics: Alpha should be one part of your quality toolkit
Understanding Data Types and Distance Metrics
Krippendorffâs alpha depends on correctly specifying both your data type (e.g. nominal, ordinal, interval) and the distance metric. Using the wrong setting can dramatically skew alpha, either underestimating or overstating agreement.
For example, in a sentiment task with labels like Positive, Neutral, and Negative, treating the labels as nominal assumes all disagreements are equally severe. But if Neutral is conceptually âin the middle,â an ordinal treatment â where Neutral is closer to Positive or Negative than those are to each other â can yield more meaningful scores.
Nominal Data (Single Label)
- Examples: âDog,â âCat,â âBirdâ; âPositive,â âNegativeâ
- Binary distance: 0 (match), 1 (no match)
- Used for: Content labels, medical diagnosis, basic sentiment
Nominal Data (Multi-Label)
- Example: Tagging a post as both âScienceâ and âArtâ
- Use: Jaccard distance (ÉŦĩžš―âs default), Hamming, MASI
- Used for: Multi-topic docs, multi-object image tagging
Ordinal Data
- Ordered labels, uneven intervals (e.g., 1â5 Likert scale)
- Penalises disagreements more as they get further apart
- Used for: Quality ratings, severity levels
Interval Data
- Ordered, equal intervals (e.g., test scores, temperature)
- Use squared difference distance
- Used for: Time-based ratings, continuous assessments
ÉŦĩžš―âs ADAP platform supports both single-label and multi-label nominal IRR reports. Read our for more.
Real-World Applications of Krippendorffâs Alpha
- Human vs. AI Agreement: Alpha can compare human annotations to AI outputsâuseful when validating LLM performance. In the , alpha revealed very low agreement even among native-language fact checkers assessing hate speech. This highlights the challenge of using AI in culturally sensitive domains.
- Sentiment Benchmarking: Datasets like and used Krippendorffâs alpha to assess annotation quality. Interestingly, sentiment tasks showed lower agreement than named entity recognition tasks in the same corpora.
- Medical AI: In clinical settings, Îą > 0.90 is often required before releasing datasets. on clinical data annotation consistently use Krippendorff's Alpha to ensure annotation reliability meets medical standards before benchmark release.
- Social Media Text Analysis: Krippendorff's alpha can be applied with flexible standards where to remain relevant to the inherent ambiguity in user-generated content.
- Robotics: Krippendorffâs alpga is a valuable metric for datasets like across 63 categories with moderate reliability standards.
These domain-specific applications demonstrate how Krippendorff's Alpha adapts to different risk profiles and annotation complexities, ensuring that benchmark quality standards align with real-world application requirements.
How It Works: The Mathematics Behind Krippendorffâs Alpha
Krippendorffâs Alpha asks: Is the agreement among annotators better than random chance?
Then compares the actual agreement we observe among annotators with what we'd expect if they were making decisions randomly, such that:
- Perfect agreement â Îą = 1
- Random agreement â Îą = 0
- Systematic disagreement â Îą < 0
- The formula for Krippendroffâs alpha is:
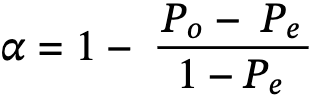
- Po = Observed Agreement
This measures the actual agreement observed among the raters. It's calculated using a coincidence matrix that cross-tabulates the data's pairable values. - Pe = Chance Agreement
This represents the amount of agreement one might expect to happen by chance. It's an essential part of the formula as it adjusts the agreement score by accounting for the probability of random agreement. - Po and Pe = Disagreement
In the context of Krippendorff's Alpha, disagreement is quantified by calculating both observed and expected disagreements
Letâs walk through a real example.
Example: Annotating for Sentiment Analysis
To illustrate how Krippendorff's Alpha works in practice, let's walk through a sentiment analysis scenarioâspecifically, an example involving nominal data types. Sentiment categories like Positive, Negative, and Neutral are distinct without any inherent order, making them a classic case of nominal data. Subjective interpretations are common (for instance, deciding whether "okay" is positive or neutral), missing annotations frequently occur in real projects, and the results have a direct impact on LLM training data quality. In such cases, agreement levels among annotators not only demonstrate the utility of the metric but also reveal whether the annotation guidelines are sufficiently clear for consistent decision-making.
Imagine 3 annotators labeling 8 social media posts as Positive, Negative, or Neutral. Hereâs what their data annotations look like:
We summarize how often each post received each label, calculate observed and expected agreement, and apply the alpha formula, such that:
- n = 8 (number of posts)
- q = 3 (number of sentiment categories: Positive, Negative, Neutral)
- r = number of times post i received sentiment k
- °ųĖ = average number of raters per post
Step 1: Create a table
Count how often each post received each sentiment label:
Step 2: Choose a Distance Metric
For nominal sentiment data, we use binary distance:
- Perfect match = 1 (e.g., Positive vs Positive)
- No match = 0 (e.g., Positive vs Negative)
Step 3: Observed Agreement - Po
For nominal data, we calculate agreement for each post using the formula:
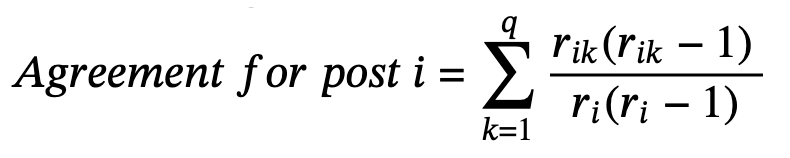
Where:
- rik = number of times post i received sentiment k
- ri = total number of ratings for post i
Letâs work through this part of the example for the first post. Weâll replace rikâŊwith the value in the table for each post i and rating k, and sum these results. For the first post:
- ri Positive = 3
- ri Negative = 0
- ri Neutral = 0
- ri = 3 (total ratings for post)
Calculation for Post 1 Agreement
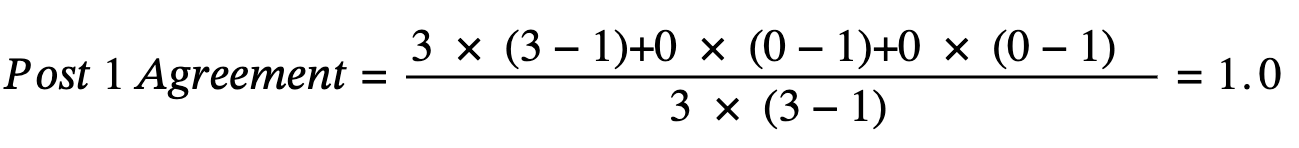
This makes intuitive sense: when all annotators agree perfectly (all chose "Positive"), the agreement is 1.0 (perfect agreement)
We do this for every post in the table and sum the results

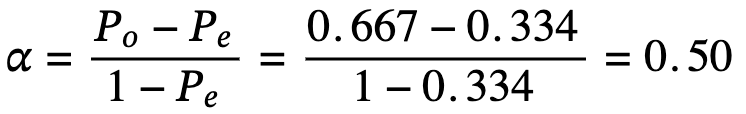
In this example, the observed agreement PoâŊturns out to beâŊ0.667.
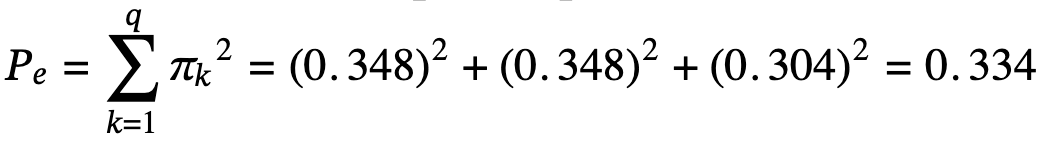
Step 3: Expected Agreement (Pe)
Now we calculate what agreement we'd expect by chance, based on the overall frequency of each sentiment label.
Count total label occurrences across all posts:
Calculate probabilities for each sentiment:
- Ïpositive = 8/23 = 0.348
- Ïnegative = 8/23 = 0.348
- Ïneutral = 7/23 = 0.304
Calculate expected agreement (sum of squared probabilities):
Step 4: Final Calculation
Now plug both values into the formula:
Interpreting the Results
Krippendorff's Alpha values range from -1 to +1, where:
- >0.8âThis range is reliable. If you apply Krippendorffâs alpha to your data, and you get a result of 0.8 or higher, you have high agreement and a dataset that you can use to train your model.
- 0.67â0.8âThis range has low reliability. It is likely that some of the labels are highly consistent and others are not.
- 0â0.67âAt less than 0.67, your dataset is considered to have low reliability. Something is probably wrong with your task design or with the annotators.
- 0âRandom distribution.
- -1âPerfect disagreement.
An alpha ofâŊ0.50âŊis considered low reliability. It likely indicates the need for better training, clearer guidelines, or a refinement of the labeling schema.
Common Pitfalls and Fixes
Beyond Agreement: Building Better Annotation Pipelines
Even strong agreements donât guarantee high-quality data. Annotators can unanimously miss subtle but important features.
Krippendorffâs Alpha should be used alongside:
- Ground truth comparisons
- Regular audits
- Contributor training
- Confidence scores
- Task decomposition
- Metrics like accuracy, precision, and recall
Relying solely on agreement risks reinforcing shared bias. By combining alpha with broader human-in-the-loop techniques, teams can better diagnose reliability issues and produce stronger datasets.
Final Takeaway
Krippendorffâs Alpha is a powerful, flexible tool for measuring annotation consistencyâbut itâs not the whole story. To build trustworthy, high-performing AI systems, teams need a multi-layered approach to data quality.
Want to learn more about quality metrics?
Check out ÉŦĩžš―âs guide to AI data quality or get in touch to explore how we help teams improve data reliability at scale.
â